Echo Yu's Portofolio
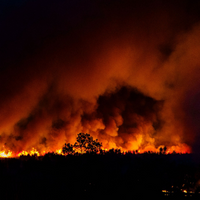
Australia Bushfire Analysis Dashboard
Due to the hot weather in the central region of Australia, bushfires often break out in summer, especially at the end of 2019. This dashboard has interactive map with fire spot layer and brightness of heatmap layer, bar&scatter plot of weather data, bubble chart with slicing bar with IQR data.

Belly Button Biodiversity Dashboard
This Plotly project represents an interactive dashboard to explore the Belly Button Biodiversity dataset, which catalogs the microbes that colonize human navels. The dataset reveals that a small handful of microbial species (also called operational taxonomic units, or OTUs, in the study) were present in more than 70% of people, while the rest were relatively rare.

Behavioral Rish Factor Surveillance System
The Behavioral Risk Factor Surveillance System (BRFSS) is the nation's premier system of health-related telephone surveys that collect state-level data from non-institutionalized U.S. adult residents regarding their health-related risk behaviors, chronic health conditions, and use of preventive services. Coordinated by the CDC and administered annually by each state.

Weather Changes Around Equator
Adjustable web pages of tables and plots from the data obtained from the OpenWeatherMap API, and allow low level interaction. using only JavaScript, HTML, and CSS on the web pages.

Melbourne Real-estate Analysis
Accessed to Domain API by hard coding and generated raw metadata around 10k rows and 21 columns, analysed the cleaned metadata and draw plot about the effect of COVID-19, bank interests and school ranking on property market.

Visualizing Data with Leaflet
The USGS provides earthquake data in a number of different formats. In this project visualizing map using Leaflet that plots all of the earthquakes from data set i picked from USGS based on their longitude and latitude. On the map you can select overlays in layer controls box such as Hight Contrast map, Street map, Dark map and Satellite map.