Latitude
Plots
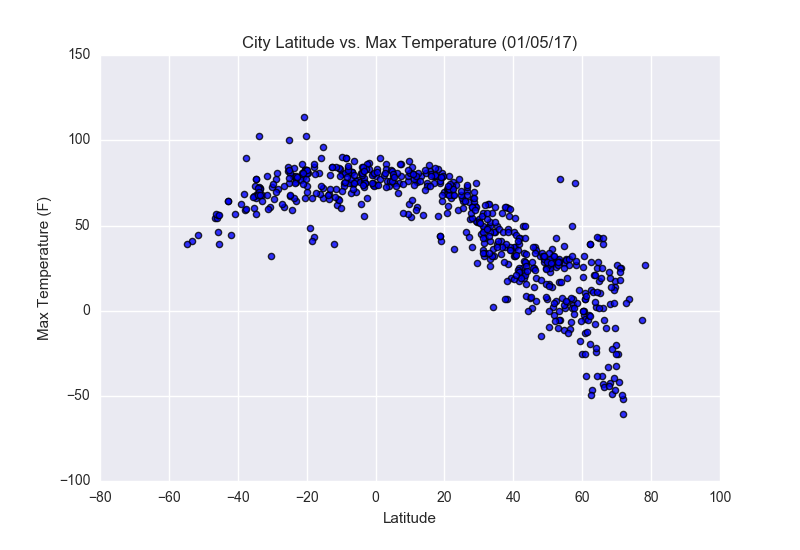
Max Temperature
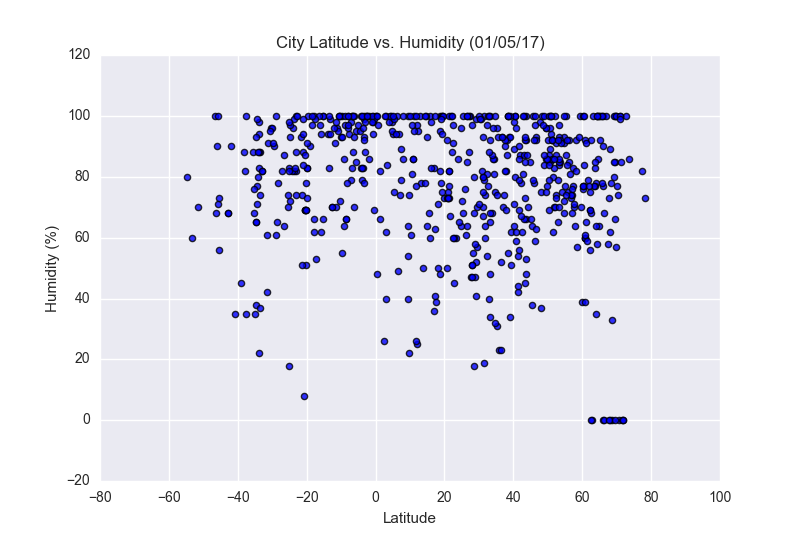
Humidity
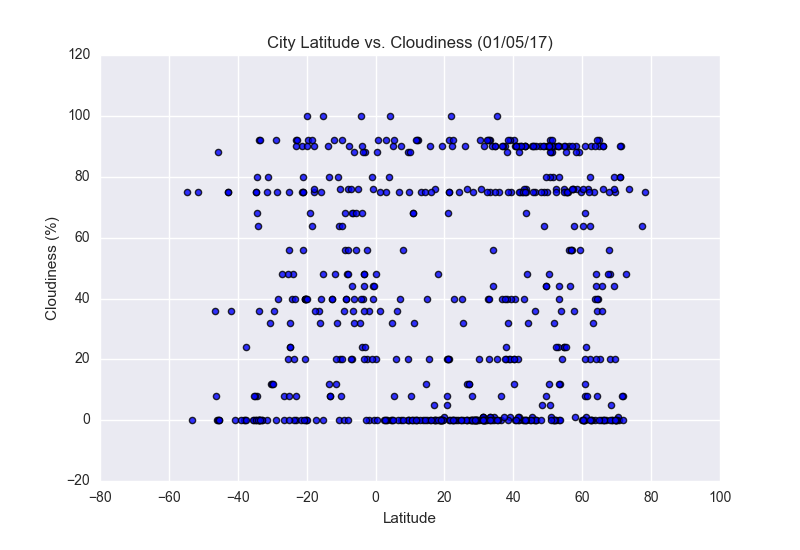
Cloudiness
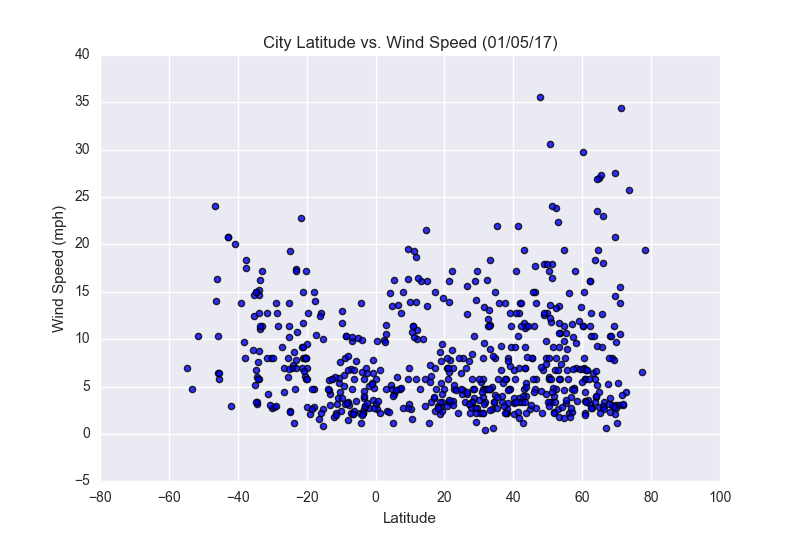
Wind Speed
Comparison
Data
Search
Max Temperature
Visualizations
Other plots
Humidity
Cloudiness
Wind Speed